Knowledge Graphs Reveal Hidden Meaning in Data

TL;DR: Knowledge graphs reveal hidden meaning in enterprise data by storing the relationships between entities as first-class data instead of leaving them implicit in separate tables. Flat stores hold the facts but lose the connections between them. A knowledge graph keeps both, so one query can traverse customers, documents, suppliers, and events, and so AI agents get grounded, explainable context instead of disconnected rows.
Most enterprises are not short on data. They are short on the links between it. A customer record sits in the CRM, the support history sits in the helpdesk, and the contract sits in a document store. Each system holds true facts. None of them holds the relationship that ties a churning account to an unresolved ticket and a renewal three weeks out. That relationship already exists in your data. A flat store just cannot show it to you.
This is the gap a knowledge graph closes. Below is what these systems actually do, why the relationship layer matters, and where it pays off.
What is a knowledge graph?
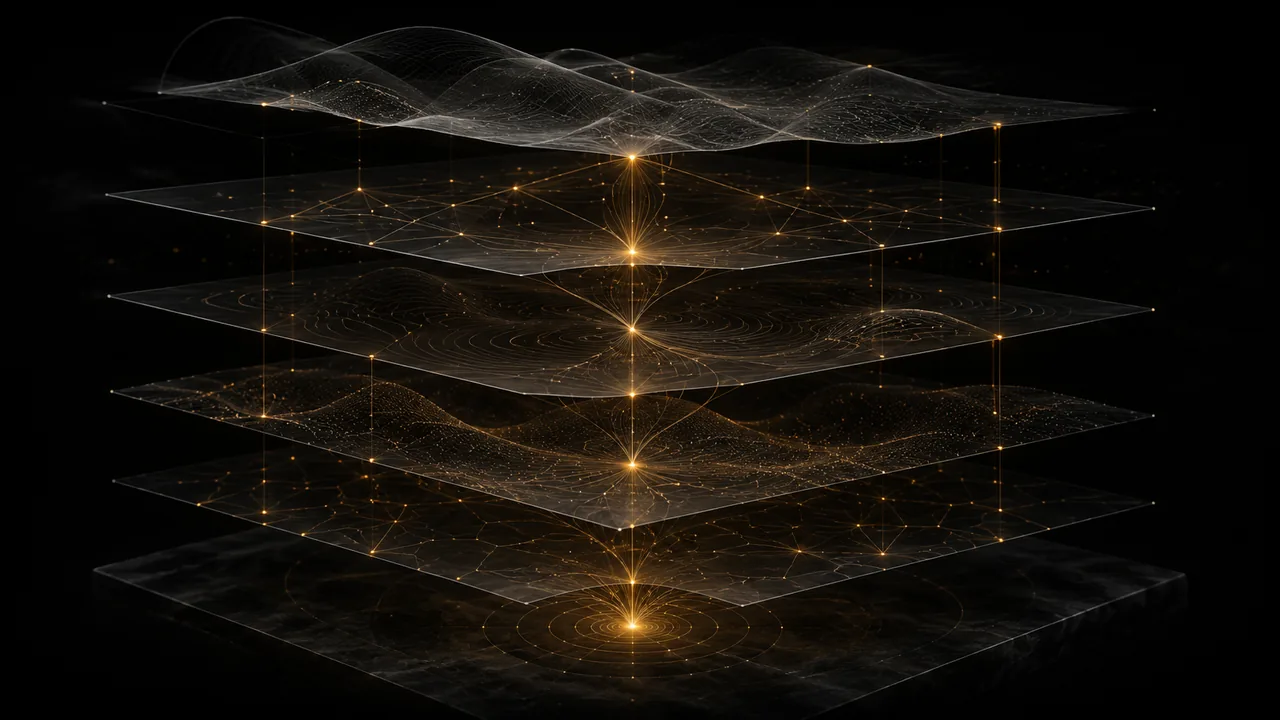
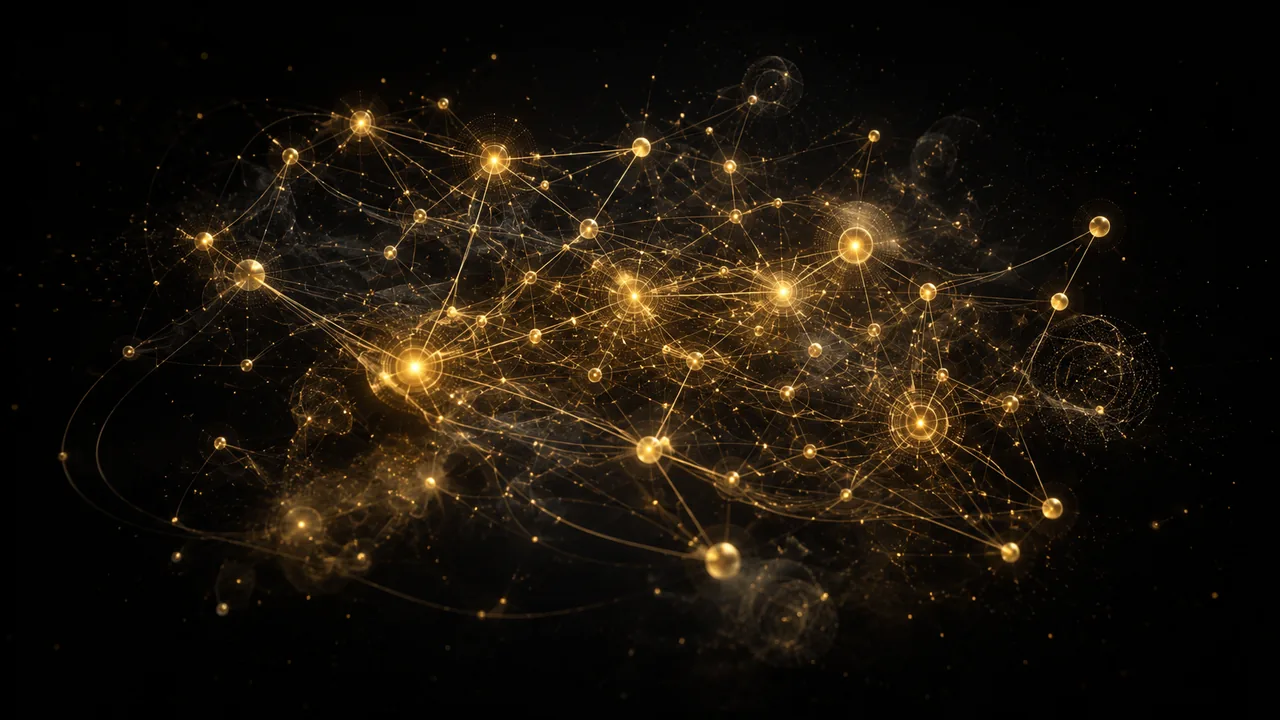
A knowledge graph represents data as entities and the relationships between them, forming a network of connected meaning. Each node is a concept, such as a product, a customer, or an event. Each edge describes how two entities relate (TigerGraph, 2025).
That structure mirrors how people actually think about information. We do not store a customer as a row in isolation. We think of the customer as connected to their orders, their last complaint, and the rep who handles them. A knowledge graph stores data the same way, which is why both people and machines can query it intuitively.
The practical effect is that you can ask business-ready questions and get explainable answers. TigerGraph gives two examples worth quoting: “Which customers are most likely to respond to an upsell campaign?” and “Which suppliers connect to our highest-risk regions?” (TigerGraph, 2025). Both questions are really questions about relationships, not about single records.
Why do flat data stores hide the meaning?
Traditional analytics systems focus on isolated data points, but context is what gives information meaning (TigerGraph, 2025). A relational database treats facts as separate pieces in separate tables, then reconstructs the connections at query time through joins. The relationship is never stored. It is recomputed, over and over, by whoever happens to write the right query.
Two problems follow from that.
- The connection is invisible until someone looks for it. If no analyst writes the join, the link between the high-risk region and the supplier simply does not surface. The data is there; the meaning is not.
- The work compounds. Every new question means new joins, and join performance degrades as relationships multiply (TigerGraph, 2025). A graph stores the relationships directly, so traversals hold near-linear performance as the network grows.
The cost of all that hidden meaning is not abstract. McKinsey’s research on knowledge work found that the average interaction worker spends an estimated 28 percent of the workweek managing email and nearly 20 percent looking for internal information or tracking down colleagues who can help (McKinsey Global Institute, 2012). A large share of that hunting is people manually doing what a connected data model would do automatically: chasing the relationship between a question and the system that holds its answer.
How a knowledge graph exposes the relationships
The shift is small to describe and large in effect. Instead of storing facts and rebuilding links on demand, a knowledge graph stores the links themselves. Transparency comes built in: where a relational system hides its logic inside code and joins, a graph makes relationships directly traceable (TigerGraph, 2025).
That traceability is what lets an analyst explain a result, an auditor verify the logic behind it, and an executive act on it with confidence. The model also bends instead of breaking. Relational schemas need frequent redesigns as the business changes, while a graph evolves as new entities and relationships arrive (TigerGraph, 2025).
A few patterns recur across industries, because the underlying problem is always a hidden relationship:
- Financial crime. A graph connects accounts, transactions, and identities to expose relationships that flat databases miss, which helps trace multi-hop money flows and beneficial ownership (TigerGraph, 2025).
- Customer experience. Preferences, interactions, and purchase history scattered across the CRM, marketing tools, and e-commerce get unified into one dynamic profile (TigerGraph, 2025).
- Cybersecurity. A graph models access patterns, credentials, and data flows, so security teams can spot lateral movement between compromised accounts before a breach spreads (TigerGraph, 2025).
In each case the data already existed. The graph just made the relationship between the pieces something you can see and query.
What this means for enterprise AI
Knowledge graphs matter for retrieval-augmented generation and GraphRAG systems that feed large language models. A graph acts as a source of truth, providing verified, structured data to ground AI reasoning, which TigerGraph links to fewer hallucinations, faster responses, and explainable outcomes (TigerGraph, 2025).
For agentic AI, the graph becomes a memory layer that evolves with new data, letting models reason, adapt, and explain (TigerGraph, 2025). An agent that can traverse relationships does not just retrieve the closest-matching document. It can follow the chain from a question to the specific record that answers it, and show its work. This is the same connective layer SemanticOS builds across an organization’s tools, so an AI agent and a person query the same set of relationships rather than separate, partial views.
A concrete example
Consider Vantage Health, a mid-size insurer whose policy, claims, and underwriting data live in three separate systems. A renewals analyst named Priya needs last year’s exception for a commercial client. The exception was approved in underwriting, referenced in a claim, and noted in an email thread she was not on.
In the flat-store world, Priya spends an afternoon. She queries the policy system, finds nothing useful, pings the claims team, waits, then asks an underwriter who half-remembers the case. The relationship between the three records exists, but no single query reaches it.
With a knowledge graph behind the same data, the client, the policy, the exception, the claim, and the people involved are connected nodes. One query traverses from the client to the exception to the claim and surfaces the email thread along the way. The graph turns Priya’s afternoon into a single explainable answer, with the chain of relationships visible so she can trust it. TigerGraph describes the same pattern for a global insurer consolidating policy, claims, and underwriting data, where report turnaround can drop from days to minutes (TigerGraph, 2025).
Key takeaways
- The meaning hidden in enterprise data is the relationship between records, and flat stores leave it implicit.
- A knowledge graph stores entities and their relationships as first-class data, so connections become directly queryable and traceable.
- Relational systems recompute relationships through joins, which keeps them invisible until someone writes the query and slows down as data grows.
- Connected data cuts the time people lose hunting across systems, a chunk McKinsey measured at close to 20 percent of the workweek.
- For LLMs and agentic AI, a knowledge graph supplies grounded, explainable context, which is the same connective layer SemanticOS provides across fragmented tools.
Frequently asked questions
What does it mean that knowledge graphs reveal hidden meaning in enterprise data?
A knowledge graph stores data as entities and the relationships between them, so connections that flat tables leave implicit become directly queryable. The hidden meaning is the relationship itself: which customer touches which product, which supplier sits behind which risk.
How is a knowledge graph different from a relational database?
A relational database stores facts in separate tables and recreates relationships at query time through joins. A knowledge graph stores the relationships as first-class data, so a single traversal can cross people, documents, and systems without rebuilding the links each time.
Why do AI systems and LLMs benefit from a knowledge graph?
A knowledge graph gives a large language model a structured source of truth to ground its answers. In GraphRAG and agentic setups it acts as a memory layer, which reduces hallucinations and produces explainable results, according to TigerGraph.
What is SemanticOS?
SemanticOS is a knowledge-graph and AI-search layer that connects fragmented enterprise tools into one operational brain, so people and AI agents can find and reason over institutional knowledge across systems.
Sources
- How Knowledge Graphs Reveal Meaning Hidden in Enterprise Data — TigerGraph, 2025-10
- The social economy: Unlocking value and productivity through social technologies — McKinsey Global Institute, 2012-07
Put a semantic brain behind your stack
SemanticOS unifies your tools and team knowledge into one real-time semantic graph. Join the waitlist for early access.